It’s a milestone that seems to have passed by without any real celebration, but last month marked the first anniversary of the general availability of Power BI’s Premium Per User (PPU) offering. At the time of it’s release in April 2021 there were certainly a few blogs and articles knocking about describing the benefits of this offering, but personally, having now been actively using PPU for a year, I feel now is a better time to add my voice to the conversation.
These days when I prepare a proposal for a client my recommendation is that they should look to implement Power BI Premium, whether that be Premium Capacity for larger clients or PPU for smaller businesses.
I believe PPU offers excellent value for money and it’s great that it opens up premium features for organisations on a smaller budget. Although the cost is doubled per user over Pro licenses I believe the benefits deliver WAAAAAY more than double the value, and especially for greenfield implementations I think it’s easier to justify that cost at the beginning of a project, rather than trying to get by on Pro in the early stages of implementation and then trying to get buy in for doubling that operational cost further down the line.
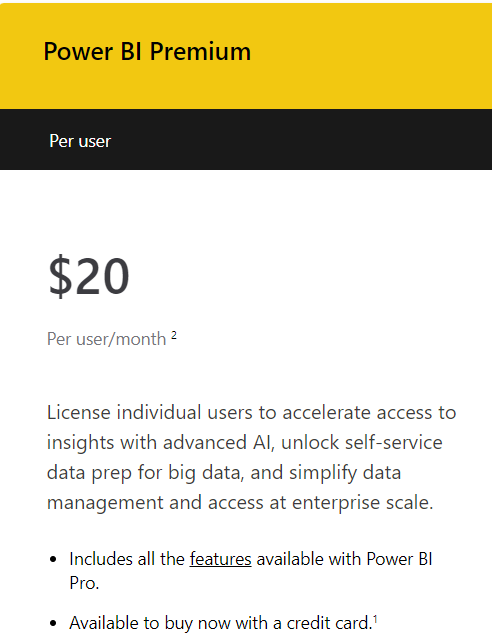
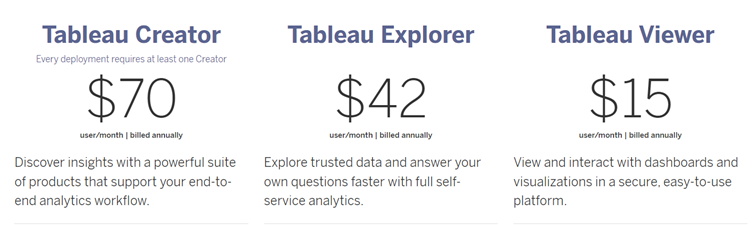
Even then at $20 dollars per user (currently that converts to £15.50 for us Brits) that is extremely competitive when compared to the competition.

Here are my favourite PPU features:
Dataset Size
For double the price, you get 100 x the dataset capacity with PPU, with the 1GB limit applied on Power BI Pro datasets lifting to up to 100GB. That’s equivalent to a P3 Premium Capacity SKU which would normally cost you $20k a month… madness! 100GB is likely to be overkill for relatively small businesses, but having to not worry about breaking that 1GB ceiling is a huge plus.
XMLA Endpoint
PPU workspaces mean being able to connect to a Power BI dataset using an XMLA endpoint. This is great for connecting tools such as DAX Studio directly to your model for measure development, testing or debugging. But my favourite feature with this is that it allows you to deploy datasets using Tabular Editor. My preferred development process is to do all of my dataset development in Tabular Editor, similar to the process described in this blog by Michael Kovalsky . This means I can save and source control my dataset in a Git repository using the serialised folder format which breaks all of the objects in your data model in to individual JSON files that can easily have changes tracked in Git. And you can then use CI/CD pipelines in products like Azure Dev Ops or Git Hub to deploy your datasets. I recently did a video on my YouTube channel demonstrating this technique.
Deployment Pipelines
The deployment pipelines in Power BI itself also become available using PPU. This allows you to set up development, test and production workspaces and easily transfer artefacts between these environments. Whilst my preference for controlling my Dataset deployments is via a Dev Ops pipeline, one pattern I like is to use the inbuilt Power BI pipelines for other artefacts such as Dataflows, Paginated Reports and “thin” reports that are connected to my Datasets. Recent improvements to pipelines that allow you to anchor artefacts to dev, test and prod environments even when they aren’t themselves in the same workspace have made this experience even better.
Paginated Reports
Ok, so I have a love/hate relationship with Paginated Reports. Having cut my BI teeth as an operational report analyst, originally using Crystal Reports and then graduating to SQL Server Reporting Services (SSRS) I thought I’d long since left behind the stage of my career where I would still be creating this type of report. But they do have their place and are great for use cases that might require content to be printed out or exported, especially for large tabular formatted type data sets. I even ended up doing a YouTube series about Paginated reports. The relatively new Paginated Report visual, that allows you to embed a Paginated Report in a Power BI report is particularly nifty, and I quite like to feature a drill-through page in my reports that allows you to go from summarised interactive content in a report to an embedded paginated report that gives people access to the low level data. It even opens up the possibility for pseudo composite models, as you can keep you high level analytical data stored in your Power BI Dataset but let people access lower level detailed data via a Paginated Report that connects directly to a database containing data at a lower grain.
Conclusion
So there are my PPU highlights. In case you can’t tell already, it’s an offering that I’m a big advocate for and I’m extremely grateful that Microsoft made this option available, allowing me to get more experience with premium features. Although Pro licensing still gives you a very powerful product, I believe PPU really unlocks the opportunity to develop an Enterprise grade reporting platform without breaking the bank.


1 Comment
Paginated Reports for Pro Users - Greyskull Analytics · November 19, 2022 at 12:42 pm
[…] I already blogged earlier this year about the fact that paginated reports was one of my favourite features of Premium per user licenses. (For what it’s worth, I still think the other additional features in PPU still make it a worthwhile option) […]